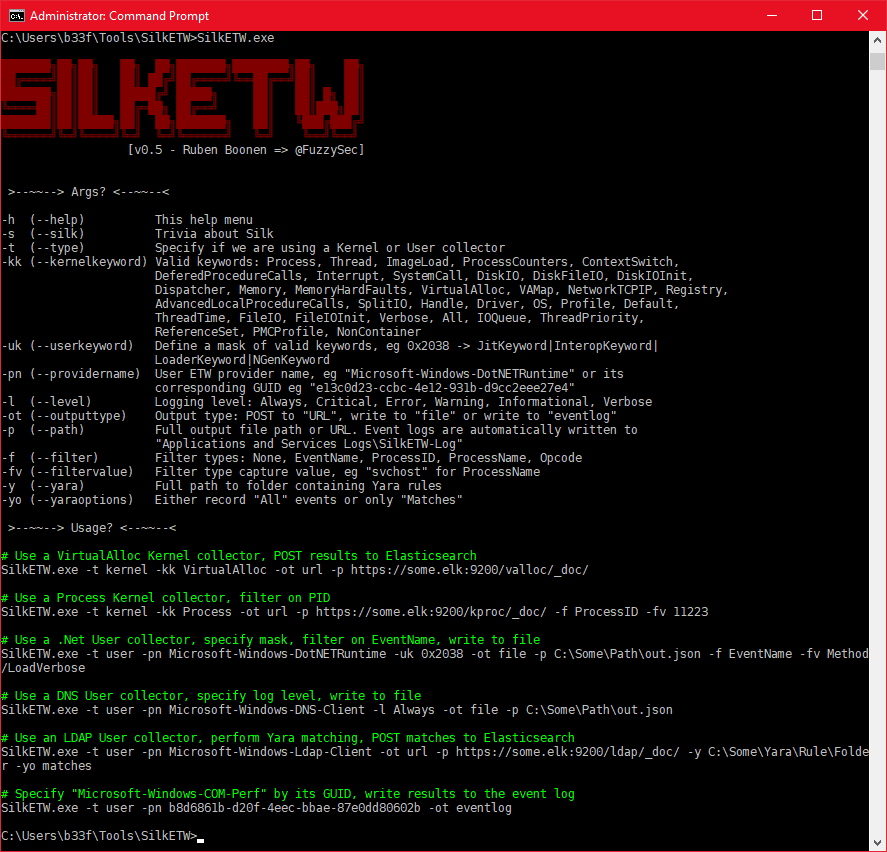
The ETW (Event Tracing for Windows) subsystem is a veritable gold mine of operational and diagnostic telemetry, but most of the data it produces is sort of a pain to consume - at least until recently. Today we'll take a stab at continuous tracing of some Deep Telemetry™ with SilkETW!
A spark of inspiration...
This weekend I'm fortunate enough to attend the last edition of DerbyCon, an infosec conference in Louisville, Kentucky! One of the talks I was looking forward to on Day 1 was a presentation by Matt Graeber (@mattifestation), colloquially titled
"How do I detect technique X in Windows: Applied Methodology to Definitively Answer this Question".
The video is already available here, and I highly recommend you watch it if you're interested in Detection Engineering on Windows!
Going to cons, meeting and talking to clever and excited people always sparks the best ideas, and I was fortunate enough to run into Matt after his talk to discuss the issue with the sort of telemetry collection methodology he described during his talk: the lack of user-friendly available tooling to efficiently consume this sort of data at volume, let alone manage configurations for what telemetry to collect.
Now, a few years ago that would have been an absolutely true statement, but as Matt mentions at the end of his talk, available open source ETW-consumer tooling has actually seen some very cool additions in the last few years, including a public release of Microsoft's KrabsETW wrapper library, and a number of different tools built on top of it and released by Zac Brown, most notably PowerKrabsEtw for PowerShell!
Early this year we saw another massive improvement in this area, when Ruben Boonen (@FuzzySec) dropped SilkETW!
SilkETW is a .NET ETW Consumer implementation, packaged as both a command line utility and a Windows Service. I played around with the CLI when it was first released, and was very impressed, but I haven't found the time to actually attempt to put it to good use yet.
After seeing the aforementioned presentation, I decided to try and recreate the results produced by a logman.exe-initiated trace session during the demo, but this time using the SilkETW Windows service instead - at least that might get us a bit closer to what a continuous detection effort might look like on a real-life system.
The use case: Detecting Lateral Movement with WMI
Let's quickly recap the assumptions of the use case we've settled on attempting to detect:
- An attacker attempts to move laterally throughout the network
- The attacker will leverage the
Win32_Process.CreateWMI class method to do so
Using WEP Explorer, logman or similar to explore and review available ETW providers and their associated message templates we've decided to take a closer look at Microsoft-Windows-WMI-Activity provider, event ID 23 in particular.
First we'll need to make SilkETW consume the events raised by the provider :)
Getting SilkETW running in the lab
First, we'll need a machine to run our tests on - I don't want to thrash my own machine with a cacophony of resource-hogging event processing tasks should I inadvertently misconfigure something (this is a prediction I base on something called "experience" :-P ), and I'm generally not a fan of running too many experimental tools (let alone the exploits) on my own laptop simultaneously.
You can use any hyper-visor you like as long as it support Windows VMs. I tend to switch between VirtualBox and Hyper-V (they're both fairly straightforward to acquire, install and configure). For completely (network-)isolated lab environments though, I tend to prefer Hyper-V, for 1 simple reason: PowerShell Direct.
Hyper-V PowerShell Direct on Windows 10 allows any admin on the host system to establish a PowerShell Remoting session over the local VM bus rather than over TCP/HTTP, meaning that I can easily copy files between my host and the VM guests without a single network connection between the two, and without awkward "shared folder" access to the host disks, and I can even remote into the guest and run my tests directly - neat!
For this test I imported the 1905 release of a Windows Developer Win10 VM from Microsoft, enabled Hyper-V Guest Services and then ran Upgrade-VMVersion to ensure PowerShell Direct support, since it only works on Windows 10 (make sure the VM is in a stopped state):
$vm = Get-VM WinDev*
Enable-VMIntegrationService -VMName $vm.Name -Name "Guest Service Interface"
Update-VMVersion -Name $vm.Name
Then all we need is grab the latest release of SilkETW from GitHub, and copy it to out VM:
# connect to the VM, will prompt for the local admin password on the vm
$vmSession = New-PSSession -VMName $vm.Name -Credential Administrator
# Copy the zip file over
Copy-Item ~\Downloads\SilkETW*.zip -Destination C:\ -ToSession $vmSession
# Unzip it to C:\SilkETW
Invoke-Command { Expand-Archive C:\SilkETW*.zip C:\SilkETW\ } -Session $vmSession
Installing and configuring SilkService
We install SilkETW as a Windows Service on the VM:
# Install it as a service
New-Service -Name SilkService -BinaryPathName C:\SilkETW\SilkService\SilkService.exe -StartupType Manual
Next up we need to author a configuration file for SilkService so that it knows what to collect. For now we'll just log to disk, so I ended up with a config like this:
<SilkServiceConfig>
    <ETWCollector>
        <Guid>1cc39829-149e-473e-b2c4-825ee3910493</Guid>
        <CollectorType>user</CollectorType>
        <ProviderName>Microsoft-Windows-WMI-Activity</ProviderName>
        <OutputType>file</OutputType>
        <Path>C:\SilkETW\data\WMI.json</Path>
    </ETWCollector>
</SilkServiceConfig>
The Guid value is just a local identifier for the ETWCollector definition, I simply generated a new one with New-Guid in powershell.
The only really interesting thing to watch out for here is the directory name in the Path tag - I forgot to manually run mkdir C:\SilkETW\data and the service instantly crashed when I tried to start it. Fortunately C:\SilkETW\SilkService\Logs\ contained a useful service log file that quickly allowed me to pinpoint this issue, yay!
[+] SilkService started at: 9/7/2019 2:21:18 AM
[!] Collector ID: 1cc39829-149e-473e-b2c4-825ee3910493; Output path does not exist
[+] SilkService stopped at: 9/7/2019 2:21:18 AM
[+] SilkService started at: 9/7/2019 2:24:50 AM
[!] Collector ID: 1cc39829-149e-473e-b2c4-825ee3910493; Output path does not exist
[+] SilkService stopped at: 9/7/2019 2:24:50 AM
[+] SilkService started at: 9/7/2019 2:27:00 AM
[+] Collector ID: 1cc39829-149e-473e-b2c4-825ee3910493; Parameter validation success
[*] Starting collector threads: 9/7/2019 2:27:00 AM
    [+] GUID:     1cc39829-149e-473e-b2c4-825ee3910493
    [>] Type:     User
    [>] Provider: Microsoft-Windows-WMI-Activity
    [>] Out Type: file
[+] Collector ID: 1cc39829-149e-473e-b2c4-825ee3910493; Starting trace collector
Putting SilkETW to the test!
Alright, now we just need two things:
- Execute a variant of the technique we want to detect
- Review the
WMI.jsonfile contents for the expected event data
For the first part I used Invoke-WMIMethod (but as Matt mentioned in the talk, you probably want to run as many variants of the attack that you feasibly can and then review and compare the telemetry each execution generates to ensure that you're actually detecting the behavior and not something particular to a specific PoC):
$calc = Invoke-WMIMethod -Class Win32_Process -Name Create -ArgumentList calc |Select ReturnValue,ProcessId
if($? -and $calc.ReturnValue -eq 0){
  Stop-Process -Id $calc.ProcessId
}
else{
  Write-Host 'Failed to spawn calc!'
}
Alright, calc spawned, now for the exciting part - reviewing the traced events!
I took a quick gander at the file contents with Get-Content .\WMI.json -TotalCount 2 and noticed that all the JSON event blobs had an EventName property we might be able to filter on, so let's have a look at that:
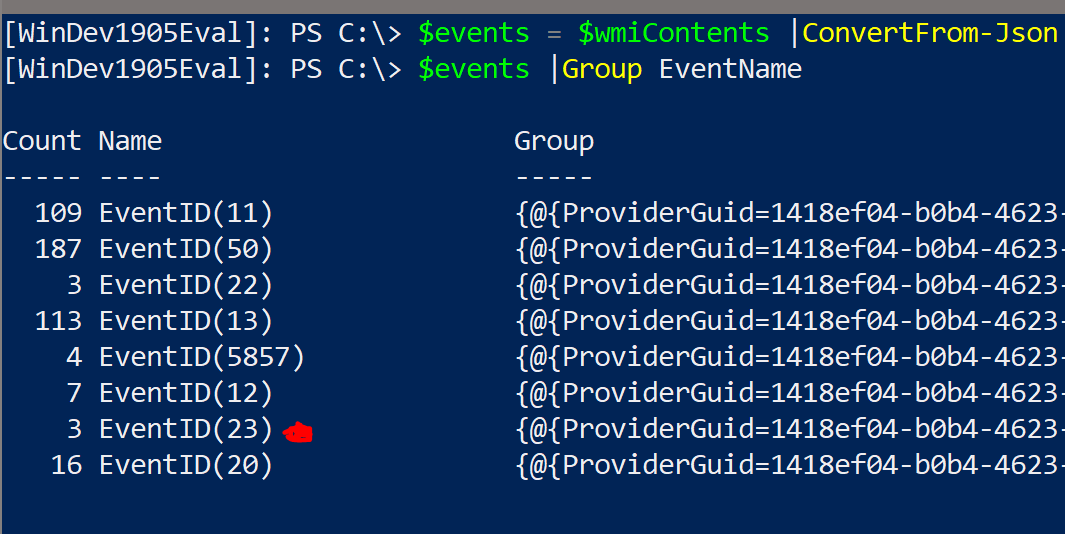
(I ran it a couple of times, hence multiple Event ID 23 instances)
Looking good! Let's grab the last event, unpack the full event XML and see if we get the target command line and (more importantly), the PID of the calling process!
PS C:\>
>> $jsonContents |ConvertFrom-Json |
>>   Where EventName -eq 'EventID(23)' |
>>   Select -Last 1 -Expand XmlEventData |
>>   Select ClientProcessId,CommandLine

ClientProcessId CommandLine
--------------- -----------
5,376              calc.exe

PS C:\> $PID
5376
Boom! Noticed that last part? The Mirosoft-Windows-WMI-Activity provider correctly recorded the client process ID (compare to $PID in the powershell.exe session).
Heureka!
Wrapping up
As I hoped to have shown with the above, SilkETW was pretty easy to set up, and allowed us to have Windows generate very valuable telemetry about a use case that's usually pretty hard to implement from scratch!
The only thing that bothered me was the logging to text files, this means that I'll need another piece of software on my machine to stream the log back elsewhere, but @FuzzySec pointed out that the ETWCollector config actually supports EventLog as an OutputType!!!
You can set the output type to eventlog ❤️
— b33f (@FuzzySec) September 7, 2019
In a follow-up post, I'll dig into how we can set that up, and hopefully filter the events raised a bit more narrowly, and - who knows - maybe we'll get into hacking on SilkETW itself as well ;)